When even lifelong democrat Larry Summers warns that inflation will hit 5% by year-end, and expects it to be anything but "transitory" as the US has "substantial inflation for real. It is not reflected in price indices but it will be or should be soon"...
This is substantial inflation for real. It is not reflected in price indices but it will be or should be soon. https://t.co/Gl8KZYRmYs
— Lawrence H. Summers (@LHSummers) June 29, 2021
... you know Joe Biden has an inflation problem, which can be summarized as a staggering 3.4% increase in core PCE.
Of course, there are extreme base effects to consider, and as Goldman's chief economist Jan Hatzius today suggests, "a simple solution is to look at the average annualized inflation rate since the start of the pandemic", which captures both the initial decline and the rebound, which would be somewhat consistent with the intellectually dishonest “averaging” approach used by the Fed’s average inflation targeting (FAIT).
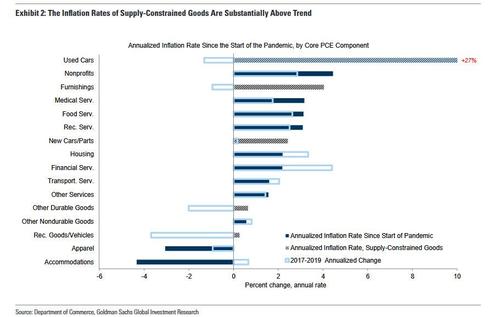
If one looks at an average post-covid inflation reading, the core PCE index has risen at a 2.4% average-annualized rate since the start of the pandemic, versus 3.4% year-on-year in May. According to Goldman, this adjustment is particularly useful in travel services categories affected by severe base effects. For example, annualized inflation has averaged -4.3% for hotels since the start of the pandemic (vs. +9.8% YoY), -3.1% for apparel (vs.+6.0% YoY), and +1.6% for transportation services (vs. +5.1% YoY).
Of course, while these revised categories help explain why the year-over-year rate of core PCE inflation is so high, they do not explain why the average annualized rate since the start of the pandemic is already above 2% after failing to reach the target on a sustainable basis during the last cycle and averaging only 1.8% in the last few years of the longest economic cycle on record.
As a reminder, on Monday we presented Goldman's thoughts how production cutbacks, supply chain disruptions, elevated demand for durable goods, and higher shipping costs have led to significant price increases in several goods categories. For example, used car prices have increased at an average annualized rate of +27.4% since the start of the pandemic (vs. +37.9% YoY and-1.3% on average between 2017–2019), furnishings prices by +4.0% (vs. +5.6% YoY and-0.9% over 2017–2019), recreational goods and vehicles prices by +0.3% (vs. +2.5% YoYand -3.7% over 2017–2019), and other durable goods prices by +0.6% (vs. +1.8% YoY and -2.0% over 2017–2019).
The chart below shows the average annualized inflation rate of various goods and services since the start of the pandemic; the particularly supply-constrained goods categories are denoted by striped bars.
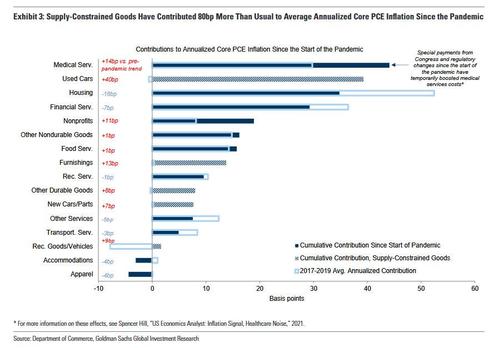
Another way of seeing the data: the next chart combines these average annualized inflation rates with category weights to show the component-level contributions to average annualized core PCE inflation since the start of the pandemic. Supply-constrained goods (again indicated by striped bars) have contributed almost 80bp more than usual to average annualized core PCE inflation,of which 40bp comes from used cars, and roughly 10bp comes from each of the household furnishings (which includes appliances and furniture) and recreational goods and vehicles categories (which includes sports equipment and televisions). If supply-constrained categories were instead running at their pre-pandemic rates, core PCE inflation would have averaged a more moderate +1.6% since the start of the pandemic.
Now, as we discussed on Monday, Goldman is firmly in the "transitory inflation" camp, and as the bank adds today "looking ahead inflation in these categories is likely to slow, undershooting their normal inflation rate as supply-demand imbalances resolve and price levels partially return to trend."
However, as we pointed out yesterday when we observed the record increase in rents across the US, Goldman also expects a pickup in inflation in slack-sensitive categories "like shelter, where average annualized inflation during the pandemic has been softer so far (+2.2% since the start of the pandemic vs. +3.3% over 2017-2019, both annualized)."
All told, the vampire squid expects these offsetting effects, combined with fading base effects, "to lead year-on-year core PCE to a bottom of 1.6% in mid-2022 before reaching 2% at end-2022", though as even the bank admits, "the average annualized rate should remain modestly above 2% throughout." It was not clear what "modestly" means although in a world where nobody can define "transitory" this is to be expected.
Then, beyond 2022 when Goldman expects the effect of payback for price spikes in supply-constrained categories to fade, the bank expects "core PCE inflation to moderately exceed 2% on both a year-on-year and average annualized basis." However, greater payback or a more limited acceleration than ot expects in cyclical categories "could leave year-on-year core inflation back in the sub-2% range seen late last cycle."
Finally, Goldman's economists conclude that "if below-2% inflation lasted for a while or lowered the average annualized inflation rate back below 2%, Fed officials might have to reconsider the appropriate inflation threshold for liftoff under their new average inflation targeting framework." Which is great... but first let's get inflation to stop rising.
© EconMatters.com All Rights Reserved | Facebook | Twitter | YouTube | Email Digest


